How far does a new Polymarket wallet get in 90 days?
September 17, 2026 · NOMOS Research · 11 min read
The question
Every month, tens of thousands of wallets make their first trade on Polymarket. Most of what is written about the platform is about the people who win. We wanted the base rate: of the wallets that show up in a given month, how many get how far, and how fast.
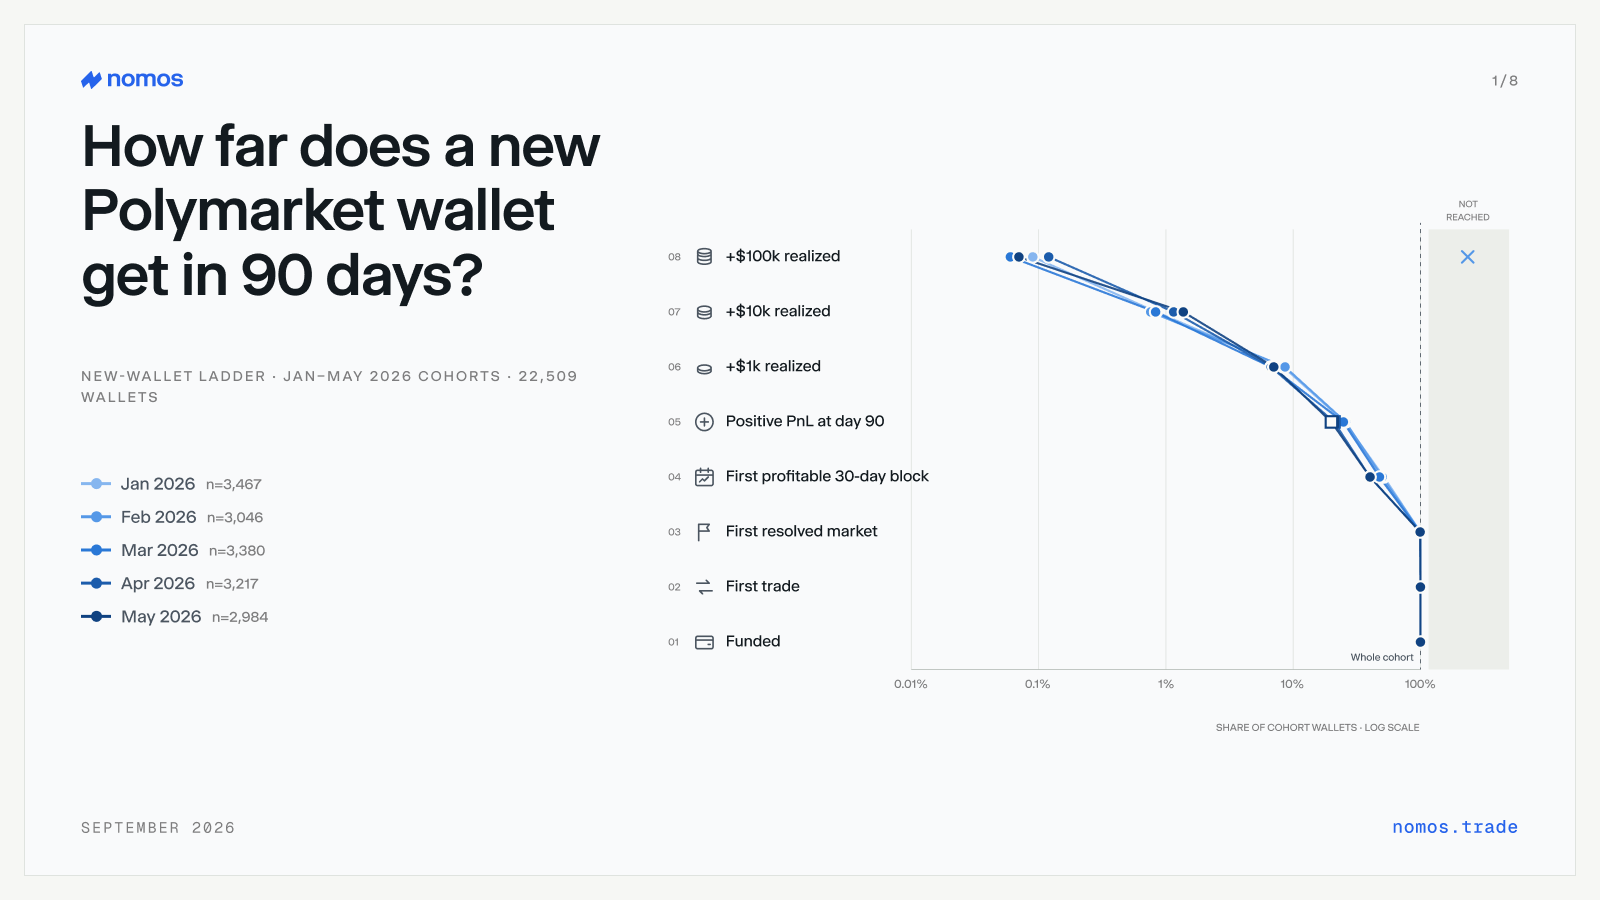
So we took 22,509 wallets whose first-ever activity on Polymarket fell in January, February, March, April or May 2026, one cohort per month, and followed each of them for exactly 90 days from that first action. We then asked the same eight questions of every wallet, in order: did it fund, did it trade, did it see a market resolve, did it have a profitable month, was it ahead at day 90, and did it ever bank $1k, $10k or $100k of realized profit. Those eight questions are the rungs of the ladder in the chart below. This note is the long version of the thread: the numbers, how we got them, what they do not say, and what Nomos is doing with them.
The ladder
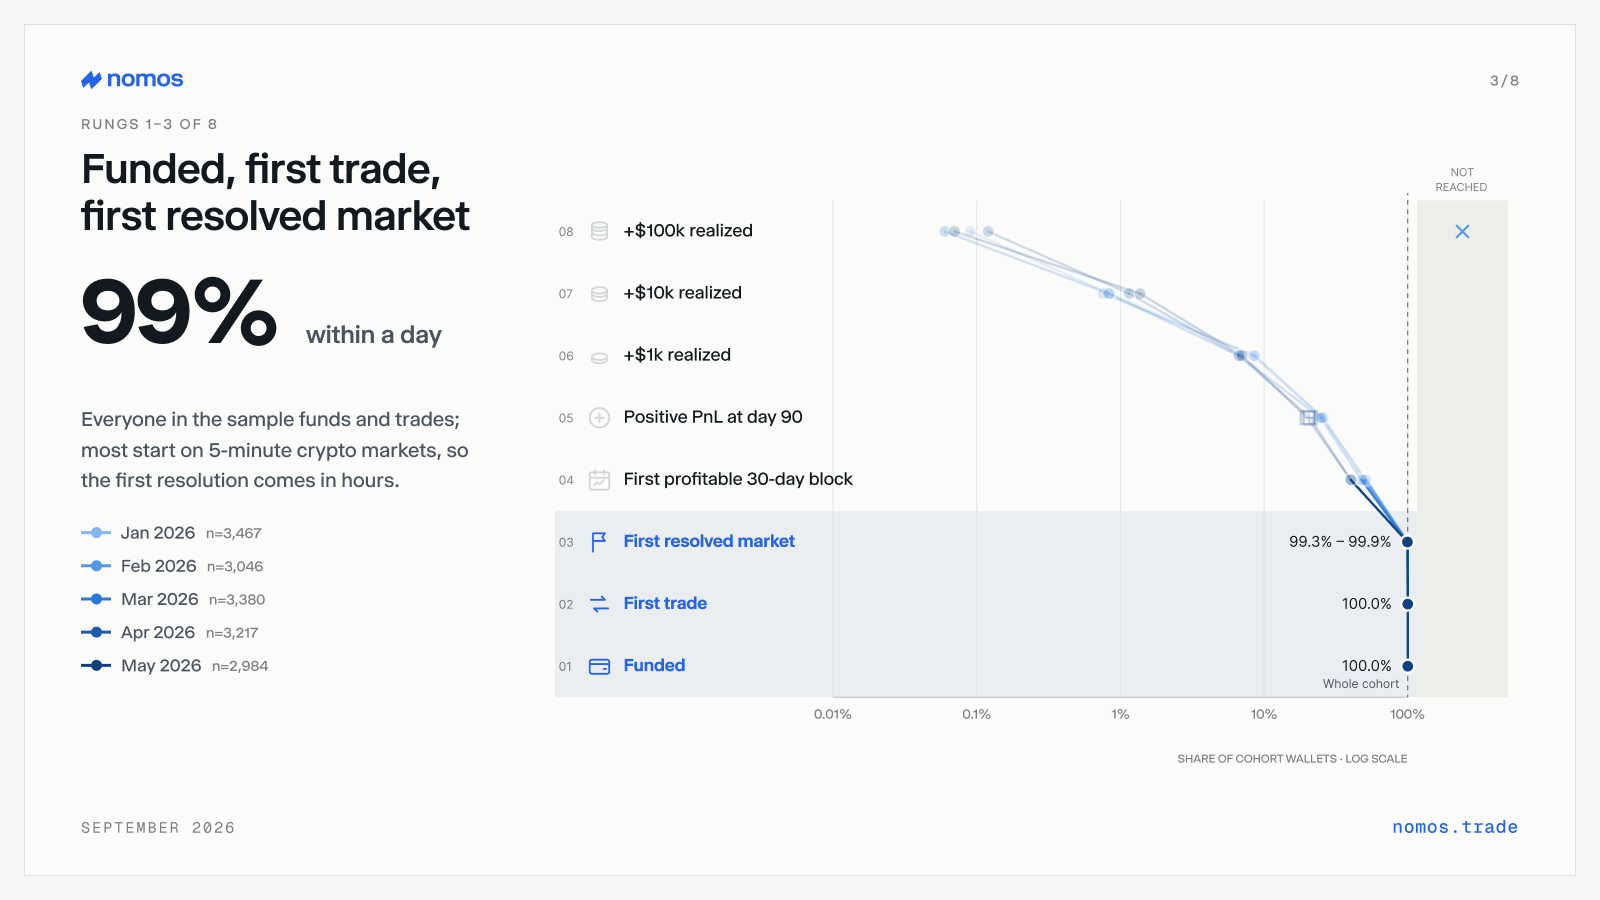
The first three rungs are, in practice, free. Every wallet in the sample funds and trades, for a reason we will come back to in the method section, and 99% see one of their markets resolve within the window. The median time to that first resolution is under a day in every cohort, because most newcomers now start on 5-minute and 15-minute crypto markets, where the result arrives before lunch.
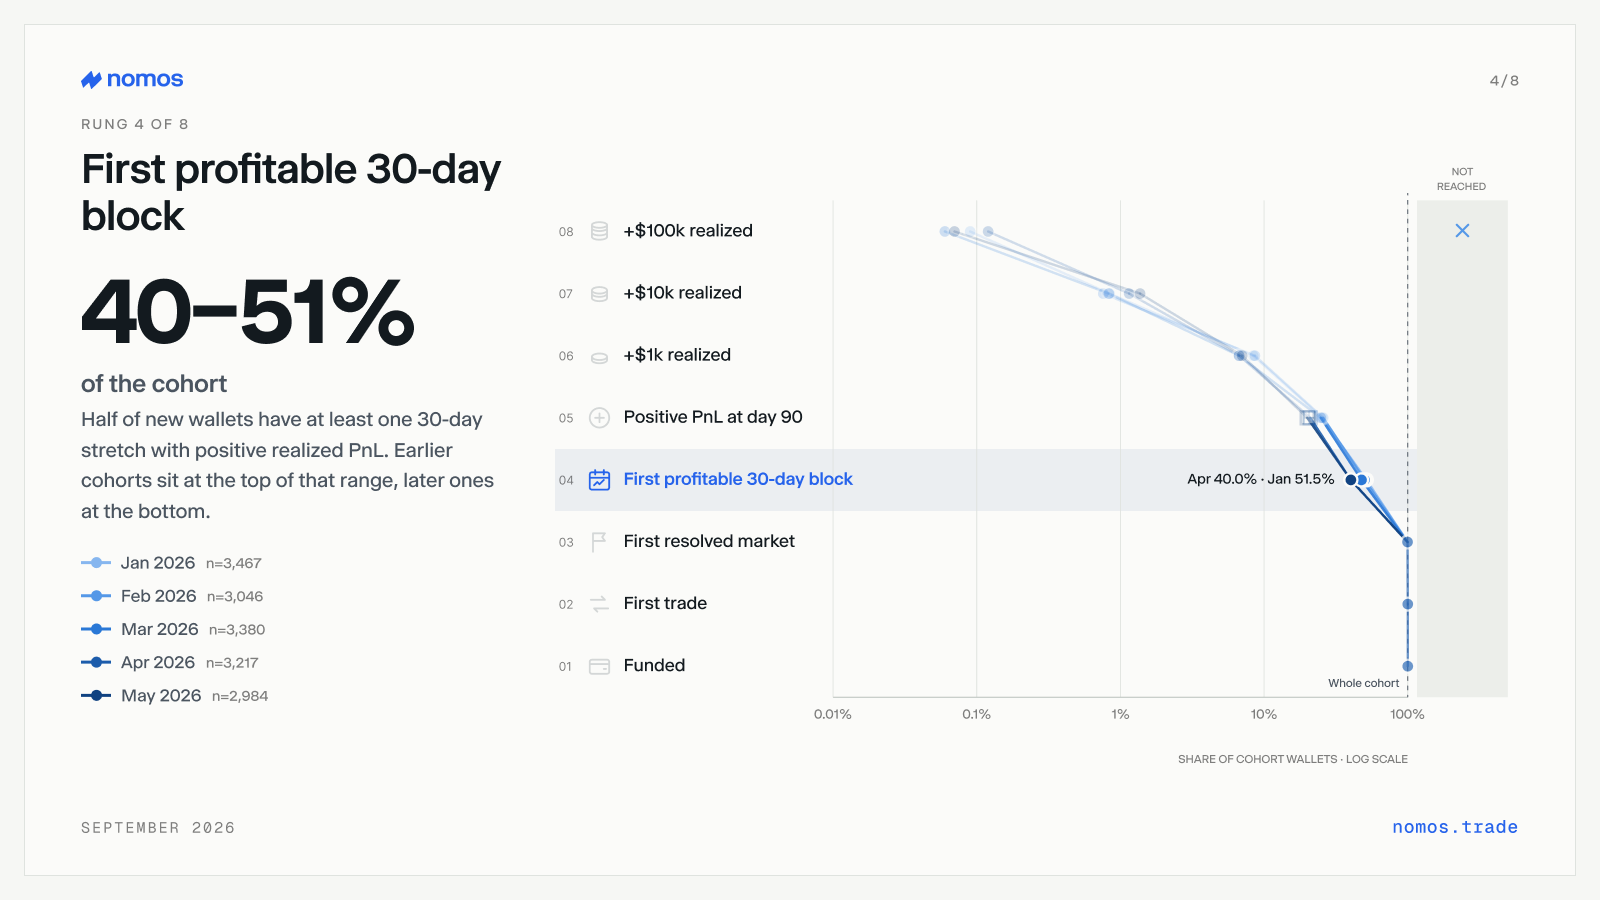
The fourth rung is where the population splits. Between 40% and 52% of a cohort has at least one 30-day block with positive realized PnL. Read literally: about half of new wallets have one good month in their first three.
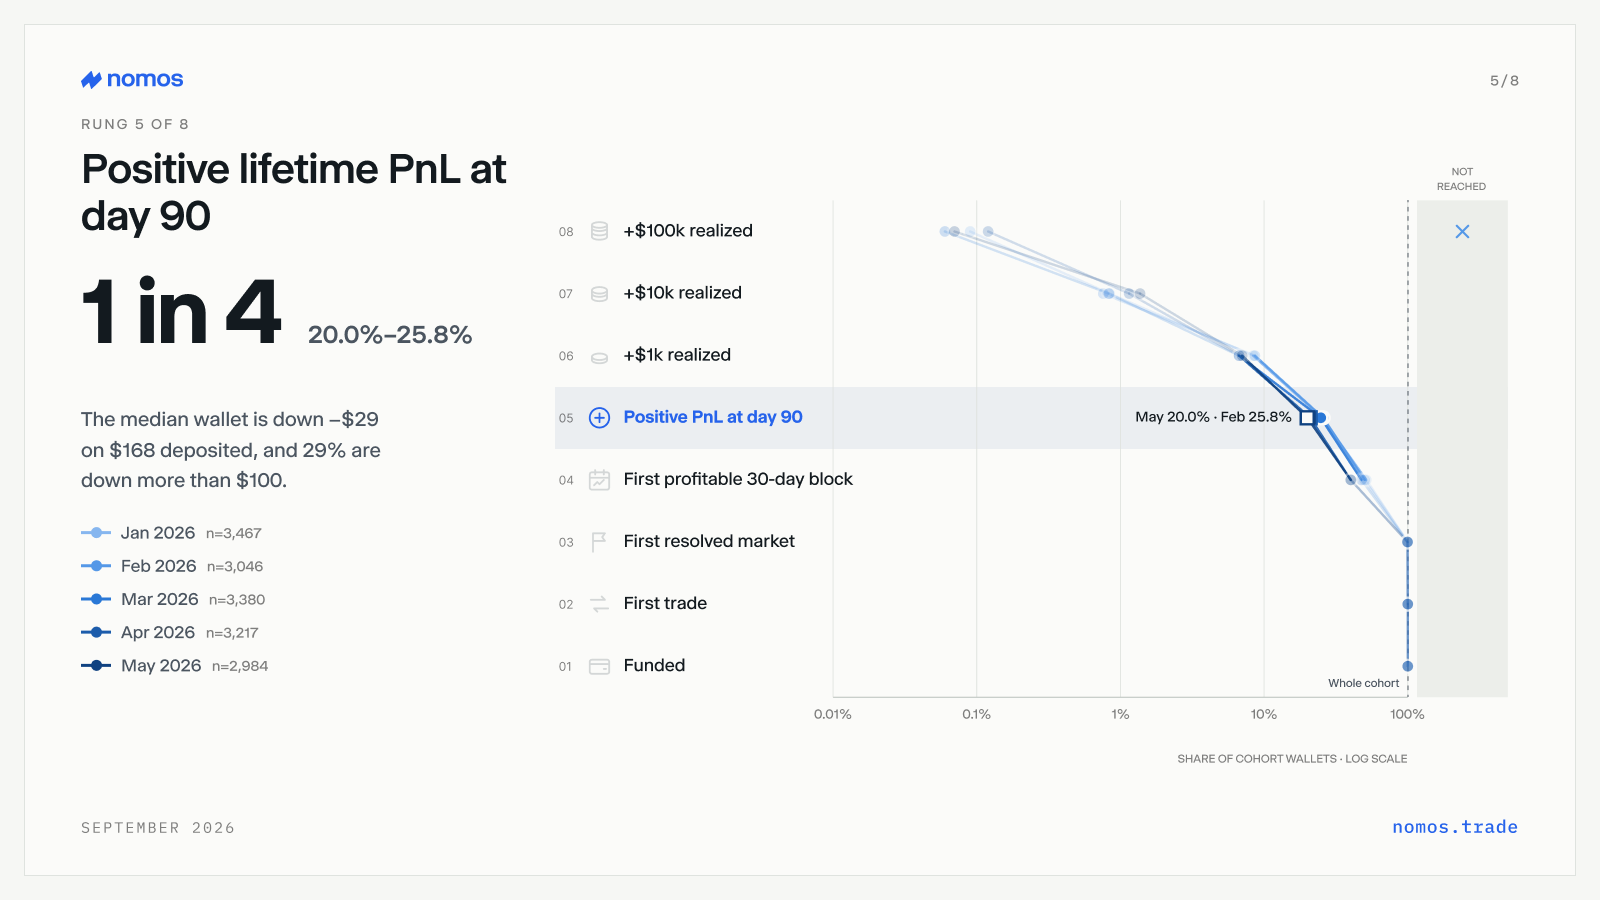
The fifth rung is where the ladder breaks. Between 20% and 26% of a cohort is net positive at day 90, counting realized profit plus the marked value of anything still open. Call it 1 in 4.
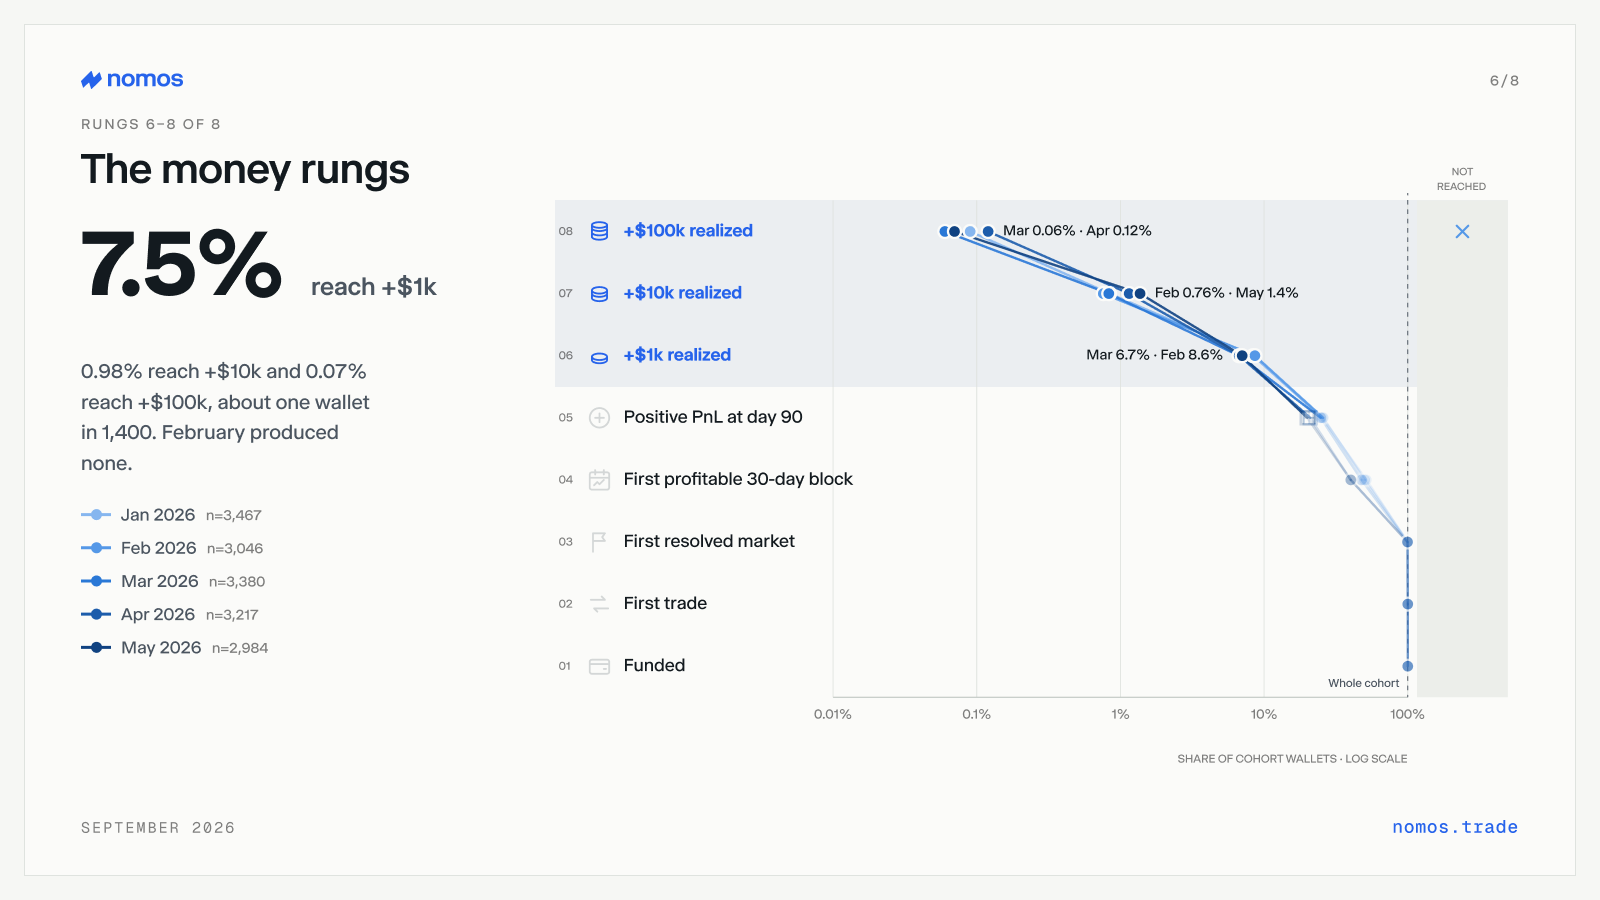
Above that, the air gets thin fast. 7.5% of wallets book at least $1,000 of realized profit inside the window. 0.98% reach $10,000. 0.07% reach $100,000, which is roughly one wallet in 1,400, and the February cohort produced none at all.
| Rung | Jan | Feb | Mar | Apr | May |
|---|---|---|---|---|---|
| 1. Funded | 100% | 100% | 100% | 100% | 100% |
| 2. First trade | 100% | 100% | 100% | 100% | 100% |
| 3. First resolved market | 99.8% | 99.9% | 99.3% | 99.9% | 99.4% |
| 4. First profitable 30-day block | 51.5% | 50.0% | 47.6% | 40.0% | 40.2% |
| 5. Positive lifetime PnL at day 90 | 25.4% | 25.8% | 24.8% | 20.9% | 20.0% |
| 6. +$1k realized PnL | 8.4% | 8.6% | 6.7% | 6.7% | 7.0% |
| 7. +$10k realized PnL | 0.84% | 0.76% | 0.83% | 1.1% | 1.4% |
| 8. +$100k realized PnL | 0.09% | none | 0.06% | 0.12% | 0.07% |
| Wallets after exclusions | 3,467 | 3,046 | 3,380 | 3,217 | 2,984 |
Rungs 4 to 8 are not nested. A wallet can bank $1k of realized profit in week two and still be underwater at day 90 because of what it is holding. Each rung is reported on its own; the shares fall monotonically anyway, which is why the chart still reads as a ladder.
The median new wallet
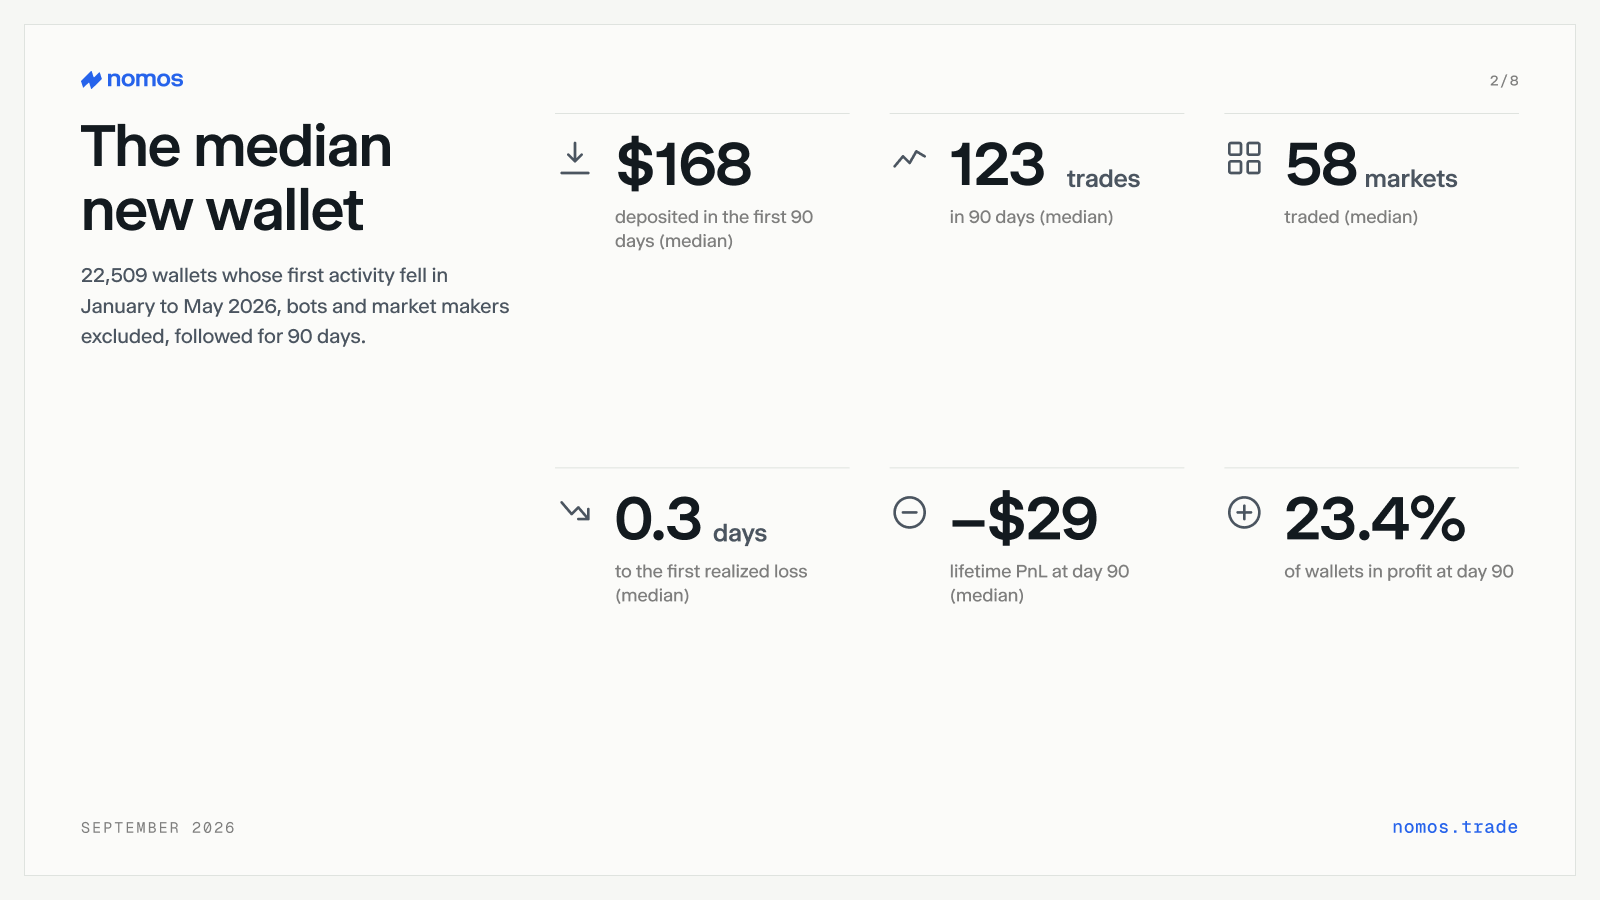
Averages are dominated by a few whales, so here is the middle of the distribution instead. The median new wallet deposits $168 over its first 90 days. It places 123 trades across 58 different markets. It takes its first realized loss within 0.3 days of its first action, about eight hours. At day 90 it is down $29. Nearly all wallets, 98.7%, take at least one realized loss; 29.5% finish more than $100 down; 23.4% finish in profit at all.
The picture that emerges is not one of reckless size. It is small stakes, high frequency, and a lot of markets. A wallet that trades 123 times in 58 markets on a $168 bankroll is paying spread and fees over and over, and on 5-minute crypto markets it is doing so against counterparties that are mostly automated.
Five cohorts, one ladder
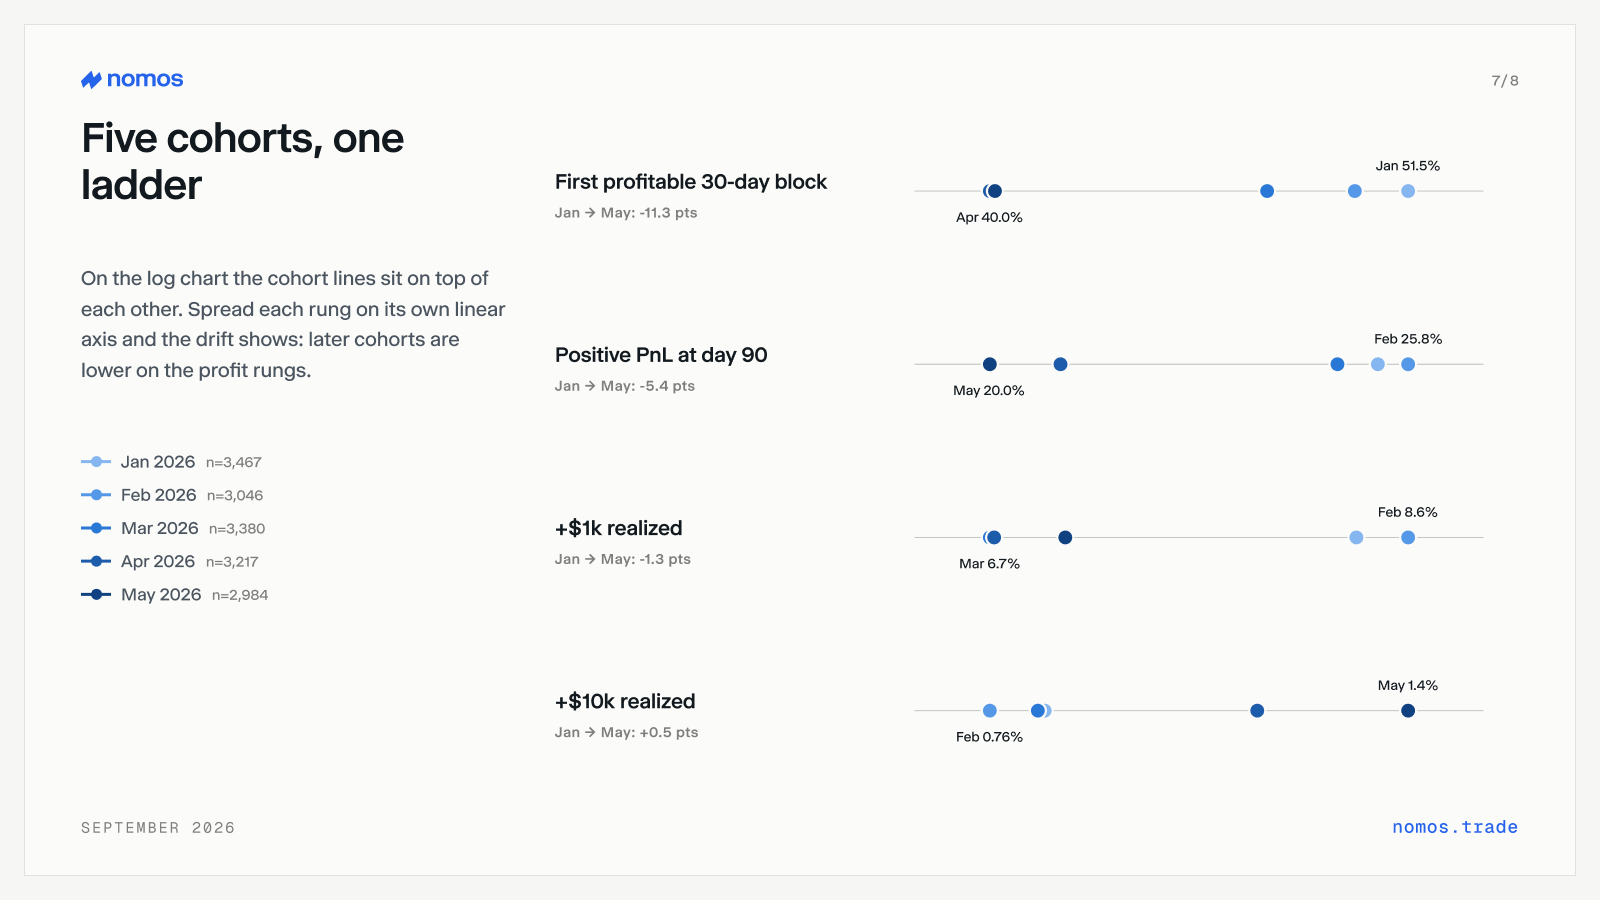
The most striking thing in the chart is how little the five lines differ. January and May joined under different news cycles, different sports calendars and a different mix of markets, and they sit within a few points of each other on every rung. With roughly 3,000 wallets per cohort, the sampling error on the 25% rung is under a point, so the January, February and March cohorts are statistically indistinguishable. The ladder is a property of the product, of its fees, spreads, resolution speed and who is on the other side of the trade, not of the month you happened to arrive.
The one movement is a slow slide. On the positive-at-day-90 rung, the April and May cohorts sit about 5 points below the first three; on the profitable-month rung, about 10 points below. That is a real gap, not noise. It coincides with a change in how newcomers start. The median number of markets traded in the first 90 days rose from 39 in the January cohort to 70 in May. The median time to a first resolved market fell from 0.8 days to 0.2. Both say the same thing: later cohorts start faster, on the 5-minute crypto markets, and they do worse. We report this as an association. The study was not designed to prove that the market mix causes the outcome, and a cohort that arrives during a crypto rally may differ in other ways too.
The only rung moving the other way is $10k, from 0.8% to 1.4%. That is 25 to 40 wallets per cohort. Directionally it fits, since faster markets create more big winners as well as more losers, but it is too thin to build on.
Method
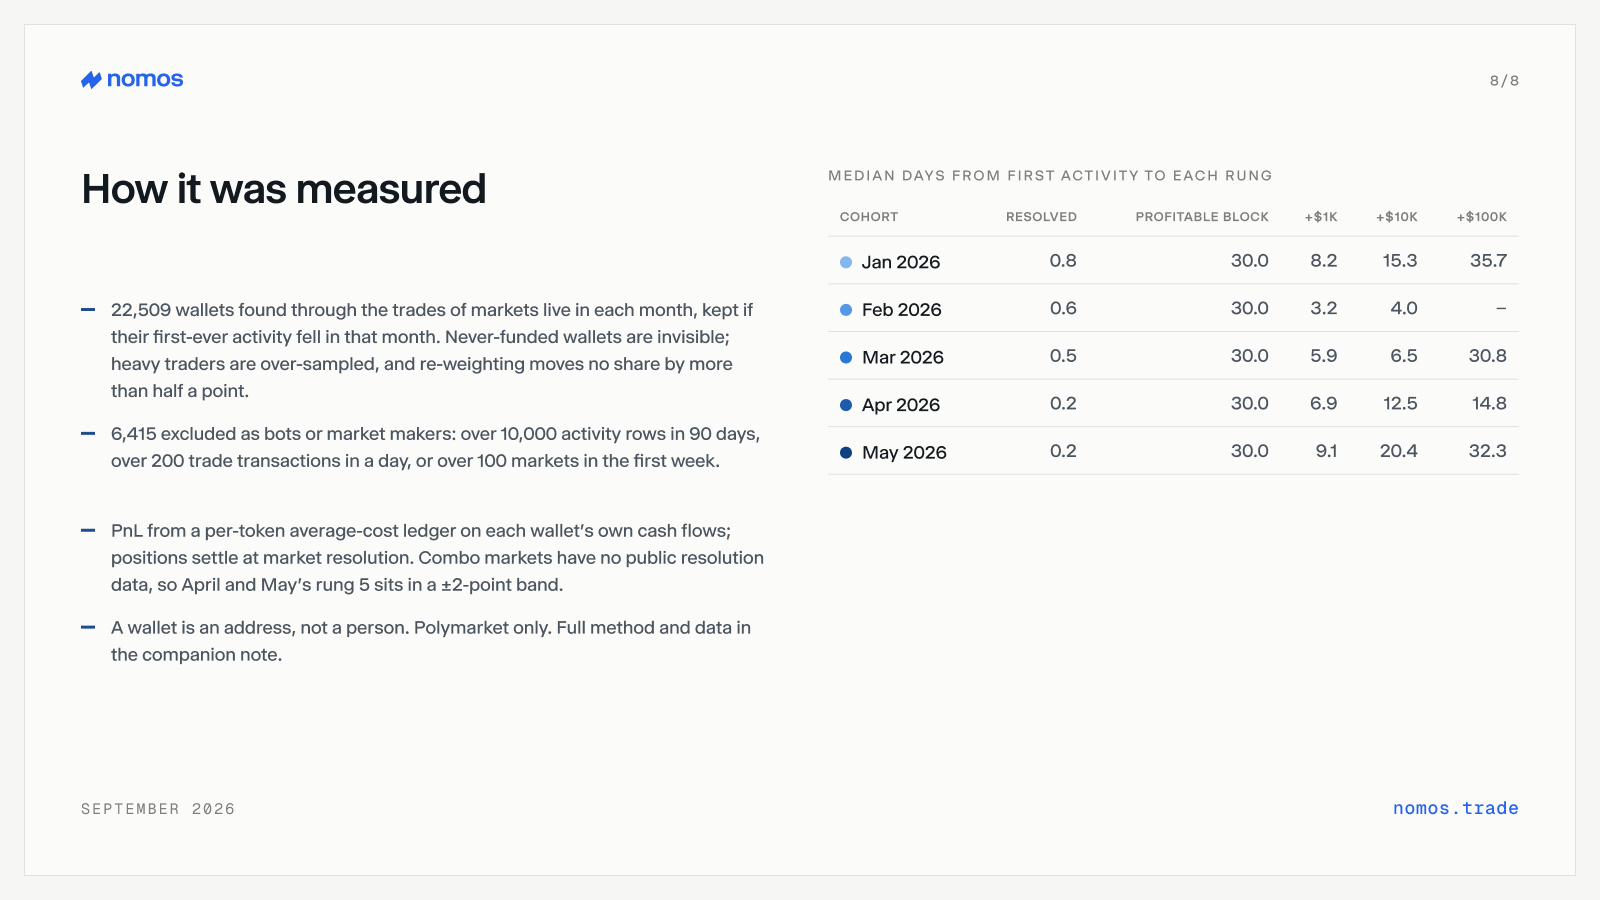
Cohorts. A wallet belongs to the calendar month, in UTC, of its first activity record of any kind, deposits included. Its horizon is that timestamp plus 90 days, and nothing after the horizon counts. We only include months in which every member's window has already closed; the June 2026 cohort qualifies on 29 September and will be added then.
Sampling. Polymarket's public trade feed cannot be windowed in time, so wallets were found through the trades of markets that were live in each month, drawn in proportion to volume, and kept only if their first-ever activity fell in that month. This has two consequences that matter, both listed in the next section.
Exclusions. Bots and market makers were removed before any rung was computed: any wallet with more than 10,000 activity rows in its 90 days, more than 200 distinct trade transactions on any single day, or more than 100 distinct markets in its first week, with each recurring 5-minute crypto series counted as one market. That removed 6,415 wallets, between 19% and 34% of each cohort, most of them 5-minute crypto traders. The thresholds are published with the data and the excluded wallets are kept in a separate table with their reasons.
Profit and loss. For every wallet we replayed its full activity, 50.3 million rows in total across 810,000 markets, into a per-token average-cost ledger built from the wallet's own cash flows. Fees are included wherever the platform charges them in cash. Every open position is settled at its market's resolution time, at the payout, whether or not the wallet ever claimed. That last rule matters: a losing position never produces a claim, so a ledger that only realized profit on claims would leave every loss unrealized forever and flatter the whole population. Positions in markets still unresolved at day 90 are marked at the last order-book price at the horizon.
Validation. We checked the ledger two ways. Against Polymarket's own per-position PnL figures it agrees to the cent on roughly half of closed positions; most of the remainder are positions where the platform's position record contradicts its own trade feed, and in those cases the ledger, not the API, reconciles with the wallet's deposits. Against the chain, for wallets that went quiet inside the window and hold nothing, deposits minus withdrawals plus ledger PnL matched the wallet's on-chain balance within a dollar for about two thirds of the sample, many to the cent.
What this does not say
- Rungs 1 and 2 are 100% by construction. Because wallets were found through trades, a wallet that funded and never traded, or never funded at all, cannot appear in the sample. The real first two rungs are lower than 100% and this study cannot say by how much.
- Heavier traders are more likely to be sampled. Re-weighting each wallet by how often it was drawn moves no rung by more than half a point, so the shape is robust, but the sample still leans toward active wallets.
- A wallet is an address, not a person. Sybils, reward farmers and copy-trading bots that slipped past the exclusions inflate the top rungs.
- Combo markets, the parlay product Polymarket launched in June, have no public resolution data. Positions in them that were still open at day 90 could not be settled, which puts the April cohort's positive-at-day-90 share somewhere between 20.5% and 22.6% and May's between 18.8% and 22.6%. Every other cohort is unaffected.
- "First resolved market" uses the market's resolution time, not the wallet's claim time. "First profitable 30-day block" uses fixed blocks from the first action.
- This is Polymarket only. Kalshi and Limitless are not comparable at the wallet level.
What Nomos is doing about it
Everything above is a measurement, and we want to keep it that way. The ladder does not tell you that any tool makes a new trader profitable, and we are not going to claim that it does.
What we can say is what the study points at, and which part of it a terminal can touch. The ladder is a property of the product a new wallet lands on: its fees, its spreads, how fast its markets resolve and who is on the other side of the trade. A terminal cannot change any of that. What it can change is how much a trader knows before the order goes in. The median new wallet here placed 123 trades across 58 markets on $168, much of it on 5-minute crypto markets where the other side is mostly automated, and took its first loss within hours of arriving. That is a lot of decisions made quickly, on one venue's order book, with nothing else on the screen.
Nomos puts Polymarket, Kalshi, Gemini and Limitless in one interface, so a market can be priced across venues before it is traded on any of them, and it attaches the context that moves a market to the market itself: on-chain flow through Signals, live event data in Atlas, briefings from Nomi. One account, one screen, and less setup between a new trader and the information they would want on day one. None of that is a promise about where a wallet ends up at day 90. It is a promise about what is in front of a trader on day one, and what they do with it is theirs.
Data and reproducibility
The pipeline is deterministic and re-runnable from Polymarket's public APIs; the chart is drawn from a single JSON file that also carries every caveat above as a footnote, and the per-wallet rung table exists for anyone who wants to slice it differently. The June 2026 cohort will be added when it qualifies.
Method v1-data-api · data through 2026-09-16 · Polymarket Data API, Gamma and CLOB